Trade show ROI is the number that decides whether the program survives the next budget cycle — and most companies are calculating it wrong. The most common error is closing the measurement window too early: measuring leads and pipeline at 30 days post-show, finding an unfavorable number, and concluding the show underperformed. In complex B2B sales cycles, the majority of revenue attributable to a trade show closes between 90 and 180 days after the event. A company that measures at 30 days is evaluating a cost, not an outcome.
The second most common error is measuring the wrong things — badge scan counts, booth visitor estimates, and social media impressions — instead of the metrics that connect to revenue: qualified lead count, lead-to-opportunity conversion rate, average deal size for show-sourced leads, and close rate compared to other lead sources. This guide gives you the formula, the right metrics, the correct measurement window, and the specific actions that improve return across every stage of the program. For the full cost input side of the ROI calculation, the trade show booth rental cost guide provides complete cost benchmarks by booth size and show market.
Why Do Most Exhibitors Calculate Trade Show ROI Incorrectly?
Three systematic errors produce ROI calculations that understate the true return of a well-executed trade show program — and overstate the return of a poorly executed one.
Measuring Too Early
The most damaging measurement error is the 30-day cut-off. For companies with a 30-to-90-day average sales cycle, a 30-day measurement captures a meaningful portion of revenue. For companies in categories where the average deal takes 90 to 180 days — enterprise software, industrial equipment, professional services, medical technology — a 30-day measurement captures almost nothing. The revenue from the show’s best leads has not yet materialized, and the ROI calculation produces a negative number that has no relationship to the program’s actual contribution to annual revenue.
Counting the Wrong Leads
Badge scan count is not a lead count. A badge scan records that a specific registered attendee was within scanning range of your device at some point during the show. It records nothing about whether that person is in your target market, whether they have purchase authority, whether they expressed interest in your product, or whether a qualifying conversation occurred. A company that reports 400 badge scans as ‘400 leads’ has generated a cold outreach list — not a pipeline. Qualified leads — visitors who match your buyer profile, have budget authority, and expressed genuine interest — typically represent 10 to 30 percent of total badge scans at a well-managed booth.
Excluding Hidden Costs
The exhibit rental or purchase cost is the most visible trade show expense — and the least complete picture of total investment. Staff travel, hotel, and per diem are frequently tracked in the travel budget rather than the trade show budget. Show services — drayage, electrical, internet, installation labor — are often billed to a different cost center than the exhibit cost. Giveaway inventory, marketing collateral, and pre-show outreach costs are absorbed into broader marketing line items. A true trade show ROI calculation requires aggregating all of these costs under a single show investment figure — otherwise the denominator is too small and the apparent ROI is misleadingly high until someone asks how the true total cost was calculated.
What Costs Should You Include in Your Trade Show ROI Calculation?
A complete trade show investment figure includes every dollar spent as a direct consequence of exhibiting at the show — not just the line items that appear in the exhibit or marketing budget.
| Cost Category | What to Include | Typical Range (10×20, Major LV Show) |
|---|---|---|
| Exhibit rental or amortized purchase | Structure, graphics, pre-build, freight to show and return | $7,000–$14,000 per show |
| Show services | Drayage, electrical, internet, I&D labor | $3,000–$7,000 per show |
| Space rental | Show organizer booth space fee | $4,000–$12,000 depending on show and location |
| Staff travel and accommodation | Flights, hotel, per diem for all attending staff | $2,500–$6,000 per person (Las Vegas, 4–5 nights) |
| Marketing collateral and giveaways | Printed materials, branded items, lead retrieval scanner | $2,000–$6,000 per show |
| Pre-show outreach | Email campaigns, LinkedIn outreach, list costs | $500–$2,000 per show |
| Staff time (opportunity cost) | Hours spent preparing, traveling, and staffing the show | Variable — often excluded but should be included |
| Total estimated investment | All of the above combined | $25,000–$55,000 for a 10×20 at a major LV show |
Most companies that discover their true total show investment is significantly higher than their exhibit line item are not surprised by the individual cost components — they are surprised by the aggregate. Building a complete show budget before the event, and comparing actuals against it in the post-show debrief, is the only way to calculate a denominator that produces a meaningful ROI figure.
What Metrics Should You Track to Measure Trade Show ROI?
The metrics that matter for trade show ROI are the ones that connect the show experience to revenue — not the ones that measure activity or visibility. Track these six metrics for every show, in your CRM, tagged by show source from the moment of lead entry.
Qualified Leads Generated
Define ‘qualified’ before the show opens — in writing, with specific criteria: job title range, company size, industry, stated purchase intent, and budget authority. Every lead captured at the show is coded against those criteria at the point of capture (or within 24 hours). The qualified lead count is the number of visitors who met those criteria — not the total badge scan count. This is the primary volume metric for show performance.
Cost Per Qualified Lead
Total show investment ÷ qualified lead count = cost per qualified lead. For a $35,000 total show investment that produces 140 qualified leads, the cost per qualified lead is $250. Compare this against your cost per qualified lead from other channels — paid search, LinkedIn, content marketing, outbound SDR — to determine whether the show is competitive on a cost-per-lead basis. Most B2B exhibitors at major shows find that cost per qualified lead from well-executed trade show programs runs $80 to $300, which is competitive with or below equivalent-quality leads from digital channels.
Lead-to-Opportunity Conversion Rate
The percentage of qualified show leads that convert to a formal sales opportunity within 90 days. This is the quality indicator — it reveals whether the qualification at the booth was accurate (high conversion rate) or whether leads were over-qualified on optimism and under-qualified on criteria (low conversion rate). A well-executed trade show booth staffing program — where staff qualify rigorously and code leads accurately — produces a lead-to-opportunity rate of 25 to 40 percent for major show programs. A booth where staff scan every badge regardless of conversation produces a rate of 5 to 10 percent, which is indistinguishable from cold outreach.
Show-Sourced Pipeline Value
The total dollar value of sales opportunities in the CRM that are tagged as sourced from the show, measured at 90 and 180 days post-show. This is the primary revenue indicator — it answers the question ‘how much potential revenue did this show put in the pipeline?’ Compare against total show investment to calculate pipeline ROI: total pipeline value ÷ total show investment. A pipeline ROI of 3x to 5x (three to five dollars of pipeline for every dollar invested) is a common benchmark for well-executed B2B programs at major shows.
Show-Sourced Revenue at 180 Days
The total closed revenue attributable to leads sourced at the show, measured at 180 days post-show. This is the definitive ROI numerator: total show-sourced revenue ÷ total show investment = trade show ROI. For shows with long sales cycles (12 months or more), measure at 12 months rather than 180 days, and track the pipeline value at 180 days as the leading indicator. A company with a 12-month average sales cycle that measures show ROI at 180 days will still find a meaningful result if the pipeline-to-revenue conversion rate from prior shows is applied as a multiplier.
Average Deal Size for Show-Sourced Leads
The average closed deal size for opportunities sourced at the show, compared against the average deal size for opportunities sourced from other channels. In most B2B programs, show-sourced deals close at 15 to 30 percent higher average value than digital-sourced leads — because the in-person qualification process connects more reliably with senior decision-makers who control larger budgets. If your show-sourced average deal size is comparable to or below your digital channel average, it signals that staff qualification is not filtering effectively for senior buying authority.
How Long Should You Measure Trade Show ROI After the Show?
The measurement window should match your average sales cycle — not an arbitrary reporting calendar. The most practical approach is to track leading indicators at 30 and 90 days and lagging indicators at 180 days and 12 months.
| Measurement Window | What to Measure | Why It Matters |
|---|---|---|
| 30 days post-show | Qualified lead count, follow-up completion rate, scheduled meetings from show leads | Early activity indicator — reveals follow-up execution quality, not revenue |
| 90 days post-show | Lead-to-opportunity rate, pipeline value from show leads, cost per opportunity | Quality indicator — reveals whether leads are converting to real sales conversations |
| 180 days post-show | Closed revenue from show leads, close rate vs. other channels, average deal size | Revenue indicator — primary ROI measurement for cycles under 6 months |
| 12 months post-show | Full closed revenue from show leads, lifetime value of show-sourced customers | Definitive ROI for programs with 6–12 month average sales cycles |
For ongoing programs — companies that exhibit at the same show annually — use the prior year’s 180-day or 12-month data as the leading indicator for the current year. If your show consistently closes 35 percent of show-sourced opportunities within 12 months at an average deal size of $45,000, you can apply those conversion factors to this year’s pipeline value to project show-sourced revenue before the cycle completes.
What Is a Good Trade Show ROI Benchmark for B2B Exhibitors?
ROI benchmarks vary significantly by industry, show quality, deal size, and execution quality. The ranges below represent well-executed programs at major B2B shows — not average performance across all exhibitors, which includes programs with weak execution that pull the average down.
| Metric | Underperforming | Acceptable | Strong | Excellent |
|---|---|---|---|---|
| Cost per qualified lead | >$500 | $250–$500 | $100–$250 | <$100 |
| Lead-to-opportunity rate | <10% | 10–20% | 20–35% | >35% |
| Pipeline ROI (pipeline ÷ investment) | <1.5x | 1.5–3x | 3–5x | >5x |
| Show-sourced close rate vs. overall | Below average | At parity | 10–20% above | >20% above |
| Follow-up completion rate (48 hrs) | <40% | 40–65% | 65–85% | >85% |
| Revenue ROI at 180 days | Negative | Break-even to 1x | 1–3x | >3x |
The most reliable indicator of where a program sits on this scale is not the booth quality or the show selection — it is the staff preparation and post-show follow-up execution. Programs that underperform on cost per qualified lead and lead-to-opportunity rate almost always trace back to insufficient staff qualification training and delayed or generic post-show follow-up. Programs that score in the ‘strong’ or ‘excellent’ range almost always have structured qualification scripts, accurate lead disposition coding, and a 48-hour personalized follow-up cadence.
How Does Booth Quality Affect Trade Show ROI?
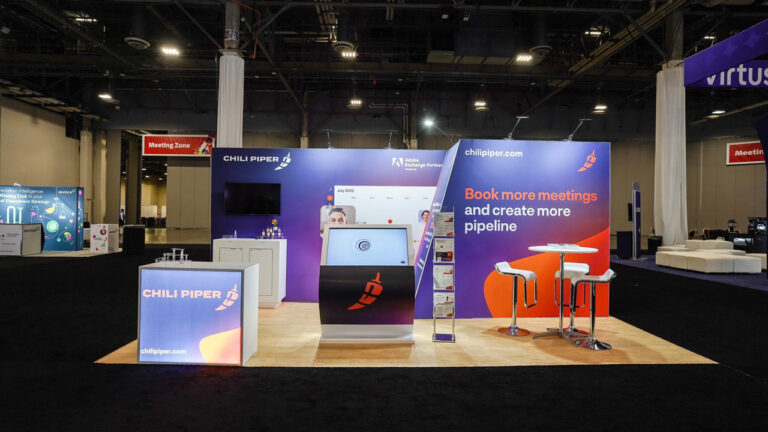
Booth quality has a direct and measurable effect on trade show ROI through two mechanisms: it determines how many qualified visitors stop at the booth (aisle conversion), and it determines the credibility impression those visitors form before the staff conversation begins. A professionally designed booth through a thorough exhibition booth design process increases qualified visitor volume and reduces the credibility objection that staff must overcome before a substantive conversation can begin.
Aisle Conversion Rate
The percentage of relevant attendees who pass your booth space and enter the booth rather than walking past is your aisle conversion rate — and it is directly correlated with back wall visibility, message clarity, and the physical credibility signal the booth sends from 20 feet away. An exhibitor at a 10×10 inline booth with a professional backlit SEG fabric display and a clear eight-word headline will stop significantly more of its target audience than a neighboring exhibitor with a printed vinyl banner on a pop-up frame, regardless of how similar their products are. At shows where your target buyer is passing 200 to 400 exhibitor booths in a day, the first three seconds of impression determine whether they slow down or keep walking.
Perceived Credibility
A visitor who enters a professionally designed, well-lit, thoughtfully laid-out booth begins the conversation with a higher baseline assumption of vendor credibility than a visitor entering a minimal or disorganized setup. This credibility assumption reduces the time staff must spend establishing basic vendor legitimacy — which leaves more of the conversation time available for qualification, demonstration, and next-step commitment. The booth design is not just a visual exercise; it is a credibility investment that multiplies the effectiveness of every staff conversation that happens within it.
The ROI Impact of Booth Upgrade
The incremental cost of upgrading from a shell scheme or basic pop-up display to a professional modular rental system — typically $3,000 to $6,000 for a 10×10 trade show booth — needs to be evaluated against the incremental lead value it generates. If the booth upgrade increases your qualified visitor count by 25 percent (a conservative estimate based on aisle conversion improvement) and your average deal size is $30,000, a single additional closed deal from the upgraded booth pays for the upgrade 5 to 10 times over. The ROI calculation for booth investment is not ‘how much does the booth cost’ but ‘how many qualified conversations does this booth generate compared to the alternative, and what is each conversation worth?’
What Changes Produce the Biggest Improvement in Trade Show ROI?
Ranked by impact-to-effort ratio — the changes that move the needle most without requiring a complete program overhaul.
1. Implement a 48-Hour Follow-Up Discipline
The single highest-impact change for most programs is shifting from a 7-to-10-day post-show follow-up cadence to a 48-hour cadence for hot and warm leads. Response rates for trade show follow-up emails sent within 48 hours of show close are two to three times higher than the same email sent at seven days, when the attendee has returned to their normal inbox load and the show conversation has faded. Drafting the follow-up template before the show — so the team can personalize and send it on the last evening of the show — is the enabling process change that makes the 48-hour window achievable.
2. Define and Enforce Lead Qualification Criteria
The second highest-impact change is replacing open badge scanning with a two-question qualification gate: what brings you to the show this year, and what is your purchase timeline in this category? These two questions, asked by every staff member for every visitor, produce a lead list where 60 to 80 percent of entries are genuine prospects — versus a list where 10 to 30 percent are genuine prospects when badges are scanned indiscriminately. The cost of adding one bad lead to the list is not zero: it consumes SDR follow-up time, inflates the cost per qualified lead metric, and makes the CRM increasingly less useful as a forecasting tool.
3. Add Lead Disposition Codes at the Point of Capture
Coding each lead at the point of capture — hot (active evaluation, near-term budget, senior decision-maker), warm (interested but longer timeline or junior role), cold (no current budget or no product fit), press, competitor — enables the sales team to prioritize follow-up immediately rather than reviewing every lead equally. Hot leads should receive phone calls within 24 hours. Warm leads receive the 48-hour email sequence. Cold leads receive a lower-priority nurture sequence. Without disposition codes applied at the show, the entire list receives the same follow-up — which means hot leads are delayed and cold leads receive the same attention as warm ones.
4. Select Shows Based on Buyer Density, Not Show Prestige
Exhibiting at a smaller show where 40 percent of attendees match your ideal customer profile will consistently outperform exhibiting at a larger, more prestigious show where 8 percent of attendees match your profile. Show prestige is a brand consideration. Buyer density is an ROI consideration. Use the trade show booth size calculator to right-size your footprint at each show, and evaluate each show’s attendee demographics report against your ideal customer profile before committing to space. A $15,000 investment at a high-density show produces more qualified pipeline than a $40,000 investment at a low-density show, regardless of the shows’ relative industry profiles.
5. Rent Instead of Own if Freight Costs Exceed Rental Costs
For exhibitors at Las Vegas shows who are shipping an owned exhibit from another city, the round-trip freight cost for a 10×20 kit — typically $3,000 to $6,000 each way from major U.S. cities — frequently exceeds the per-show cost of renting the same exhibit from a Las Vegas-based exhibit house. The rent or buy trade show booth guide provides the full break-even analysis, but the short version is: if you exhibit at one to three Las Vegas shows per year, renting from a Las Vegas exhibit house almost certainly reduces your total show cost — which improves ROI by reducing the denominator without changing the numerator.
How Do You Build a Business Case for the Trade Show Budget?
The internal business case for trade show investment is most persuasive when it uses the same language the finance and executive team uses for evaluating any marketing investment: total cost, cost per qualified lead, pipeline value generated, and projected revenue at close. The first-time trade show exhibitor tips guide covers the show preparation workflow; this section covers the financial argument for the budget itself.
The Forward-Looking Business Case
A forward-looking business case uses known conversion rates from prior shows (or industry benchmarks for first-time exhibitors) to project the revenue outcome of a proposed show investment. The structure: total show investment ($X) → expected qualified leads at historical qualification rate (Y leads) → expected opportunities at historical lead-to-opportunity rate (Z opportunities) → expected closed revenue at historical close rate and average deal size ($R revenue). Compare $R against $X to calculate projected ROI. If $R ÷ $X ≥ your company’s marketing ROI threshold (often 3x to 5x), the investment is justified on current evidence.
The Competitive Presence Argument
For shows where your direct competitors exhibit and your company does not, the business case includes the cost of absence — the impression created among buyers, partners, and press when a company that should be present is not. In categories where annual trade shows are the primary venue where vendor selection and relationship building happen, consistent absence sends a signal about company health and market commitment that is difficult to counteract through digital channels alone. The cost of absence is qualitative but real — and it compounds over multiple years of non-attendance.
Using Prior Show Data to Strengthen the Case
The strongest business case for trade show budget uses your own historical data: cost per qualified lead at prior shows, lead-to-opportunity conversion rate, close rate for show-sourced leads, average deal size. These company-specific numbers are more persuasive than industry benchmarks because they reflect your actual program performance. If your prior show produced a 3.2x pipeline ROI, the case for repeating the investment is evidence-based — not an aspiration. Building and maintaining this historical data set across every show is the most valuable asset a trade show program can accumulate.
Conclusion
Trade show ROI is calculable, improvable, and defensible — when measured correctly. The formula requires a complete cost denominator, a qualified lead numerator (not a badge-scan count), and a measurement window that matches your sales cycle rather than a reporting calendar. The programs that report consistently strong trade show ROI are not exhibiting at different shows or spending more — they are executing more precisely at the qualification stage, following up faster after the show, and measuring longer before declaring an outcome.
Start with the correct cost total. Tag every lead by show source at point of entry. Measure at 90, 180, and 365 days. Build the historical data set that makes the next budget conversation easier than the one you are having today.
Let’s Build Something Extraordinary
Share your event details and we’ll craft a custom booth solution designed to captivate your audience and maximize your ROI.
Frequently Asked Questions
What is a good ROI for a trade show?
A strong trade show ROI for a B2B program at a major show is 3x to 5x pipeline value on total investment (three to five dollars of qualified pipeline for every dollar invested) and a positive revenue ROI of 1x to 3x at 180 days (one to three dollars of closed revenue for every dollar invested). These figures apply to well-executed programs at shows with high buyer density for the exhibiting company’s category. Programs with weak qualification processes, delayed follow-up, or poor show selection will underperform these benchmarks even with a high-quality exhibit and significant investment. Execution quality is the primary determinant of where a program falls on the ROI range.
How do you calculate trade show ROI?
Trade show ROI = (Revenue from show-sourced leads − Total show investment) ÷ Total show investment × 100. For a program with $80,000 in total show investment (all costs, all staff) that produces $240,000 in closed revenue from show-sourced leads at 180 days, ROI = ($240,000 − $80,000) ÷ $80,000 × 100 = 200 percent, or 3x revenue ROI. For programs with long sales cycles, use pipeline ROI as the leading indicator: Total pipeline value from show leads ÷ Total show investment. A program generating $400,000 in pipeline from an $80,000 investment has a 5x pipeline ROI — which, at a 35 percent historical close rate, projects to approximately $140,000 in revenue, or a 1.75x revenue ROI.
Why is trade show ROI difficult to measure?
Three reasons make trade show ROI harder to measure than digital channel ROI. First, the measurement window is longer than most marketing reporting cycles — revenue from trade show leads often closes 90 to 180 days after the show, which crosses budget periods and makes attribution feel uncertain. Second, lead quality is inconsistently captured — badge scans are easy to count but poor as a proxy for qualified leads, and most CRM systems require manual tagging to connect a closed deal to its trade show source. Third, costs are fragmented across multiple budgets — exhibit cost in marketing, travel in general and administrative, drayage in events, staff time in sales — making the true total investment difficult to aggregate without deliberate effort.
How long should you wait to measure trade show ROI?
Measure at multiple windows: 30 days (activity metrics — follow-up completion, meetings scheduled from show leads), 90 days (quality metrics — lead-to-opportunity rate, pipeline value), 180 days (revenue metrics — closed revenue, close rate, deal size), and 12 months for programs with long sales cycles. Do not declare a final ROI at 30 days — the vast majority of show-sourced revenue in complex B2B categories has not yet closed at that point. Set a calendar reminder at each measurement window, pull the CRM data by show source tag, and update the ROI calculation at each interval.
What costs should be included in a trade show ROI calculation?
Every dollar spent as a direct consequence of exhibiting: exhibit rental or the amortized purchase cost, show services (drayage, electrical, internet, I&D labor), space rental fee, staff travel and accommodation for all attending staff, marketing collateral and giveaway inventory, pre-show outreach costs, lead retrieval scanner rental, and the opportunity cost of staff time. Companies that include only the exhibit hardware cost in the denominator produce misleadingly high apparent ROI figures that collapse when the full cost picture is presented to finance. Build a complete show budget before the event and reconcile actuals against it in the post-show debrief.
How does trade show ROI compare to digital marketing ROI?
Trade show ROI in B2B categories competes favorably with digital marketing ROI on qualified lead cost and close rate, though digital channels typically win on lead volume and speed of attribution. Cost per qualified lead from well-executed trade show programs runs $80 to $300 — comparable to LinkedIn lead generation and often below high-intent paid search for competitive B2B categories. Close rates for show-sourced leads are typically 20 to 35 percent higher than digital-sourced leads in complex B2B sales categories, and average deal sizes are often 15 to 30 percent higher. The trade show disadvantage is volume — you generate fewer leads at a show than from a sustained digital program — which is why the strongest programs use both channels in combination.
What is the cost per lead at a trade show?
Cost per qualified lead at a major B2B trade show ranges from $80 to $300 for well-executed programs where staff apply a two-question qualification gate before recording leads. Programs that scan all badges without qualification produce a nominal cost per ‘lead’ that looks low — $15 to $50 per badge scan — but a cost per qualified lead that is two to five times higher once the unqualified contacts are removed from the count. Always calculate cost per qualified lead rather than cost per badge scan when comparing trade show cost efficiency against other lead generation channels.
How do you track trade show leads in a CRM?
Create a specific lead source code for each show — for example ‘CES 2026’ or ‘SEMA 2025’ — and apply it at the point of lead entry for every contact captured at the show. Add custom fields for lead disposition (hot, warm, cold), conversation notes (stated challenge, purchase timeline, decision-maker status), and the agreed next step. Set a reporting view that filters by lead source to pull all show-sourced leads for measurement at 30, 90, 180, and 365 days post-show. Without consistent tagging at entry, the downstream measurement depends on manual reconstruction — which produces incomplete data and underestimates the program’s contribution to revenue.
What is a pipeline ROI benchmark for trade shows?
A strong pipeline ROI for a B2B trade show program is 3x to 5x — three to five dollars of qualified pipeline value for every dollar of total show investment. An acceptable range is 1.5x to 3x. Below 1.5x signals either weak qualification (pipeline is inflated with low-probability opportunities), poor show selection (the audience does not match the buyer profile), or high show cost relative to the deal size in the category. Pipeline ROI is most useful as a leading indicator for programs with long sales cycles — it tells you what the revenue ROI will likely be in 6 to 12 months based on your historical pipeline-to-revenue conversion rate.
How do you improve trade show ROI without spending more?
The highest-leverage free improvements are: shifting post-show follow-up from 7 to 10 days to 48 hours (response rate improvement of 2 to 3 times with zero incremental cost), adding a two-question qualification gate that staff applies before every badge scan (reduces unqualified leads in the denominator), adding lead disposition codes at point of capture (enables priority follow-up that improves hot lead close rate), and building a complete cost total in the denominator (produces an accurate ROI figure that identifies which cost components are disproportionate to their contribution). These four changes cost nothing and consistently produce meaningful improvement in measured ROI across the next show cycle.
Does booth size affect trade show ROI?
Yes — but not linearly. A 10×20 booth does not automatically produce twice the ROI of a 10×10 at the same show. The ROI relationship is mediated by qualified visitor capacity (how many conversations the staff can have per day), competitive standard at the show (what your neighbors are displaying), and the product demonstration requirements that determine whether the additional space is used productively. The right booth size is the one that matches your staffing model, demonstration requirements, and the competitive visual standard at the specific show — not the largest size your budget can accommodate. Oversized booths with insufficient staff produce low aisle conversion and high cost per conversation.
How do you justify the trade show budget to leadership?
Build the business case in three parts: the cost (complete and accurate, not just the exhibit line item), the projected return (qualified leads at historical qualification rate × historical close rate × average deal size), and the competitive cost of absence (what market position is ceded to competitors who attend when you do not). Strengthen the case with your own historical data — cost per qualified lead, lead-to-opportunity rate, close rate, average deal size for show-sourced leads — rather than industry benchmarks. A business case anchored in your own program’s historical performance is significantly more credible to a finance audience than one built on third-party industry statistics. If this is a first show with no historical data, commit to the tracking infrastructure that will make the second show’s case evidence-based.